The Covid-19 virus has turned the beginning of 2020 into a surreal nightmare. The world is struggling to maintain a confident response and not let the disaster movies of the last decade become a reality. If you haven’t read it yet or don’t think the situation is extremely serious I recommend that you check out this article.
Like many of my peers, I have been in self-isolation for weeks now. While our problems pale in comparison to those of the brave health care workers fighting at the frontlines we bear an inescapable sense of dread and helplessness by having to watch the infection spread. This may explain how WirVsVirus, a hackathon organized by the German government and various impact initiatives attracted over 40,000 participants making it the largest Hackathon in history according to the organizers. But that may not be a title held for long as Facebook, Microsoft and the WHO are partnering to host a global equivalent online.
Challenge: Mapping the Covid reporting process
At first, I was unsure if there would be a way of contributing something useful and indeed the list of ideas and projects to work on that we received on Friday the 24th of March was daunting. At the time my partner Viviane and my good friend and colleague Skander were in a video call going over the list and looking for opportunities.
Since all three of us have experience working on chatbots we searched the slack workspace for people needing help in that particular area and to our luck we got in touch with Kerstin, who was looking for help building one for her district. When Skander reached out to her we got a lead on a much more relevant issue: The process of reporting and tracking new infection cases was long, cumbersome and barely digitized causing significant delays in reporting and overwhelmed local officials.
At this point I should mention that startup ventures and tech, in general, suffer from solutionism; a tendency to think that algorithms and code can solve or alleviate any problem, which often leads to approaches that start with the “how” and not the “what”.
Therefore we decided to dedicate our time to mapping out the process so that others could make informed decisions about what issues to address and how to best integrate with the existing system. This way we could be sure that if we ever came up with a proposal it would be rooted in reality, but in any case we would have supplied other teams with vital information.
Our findings
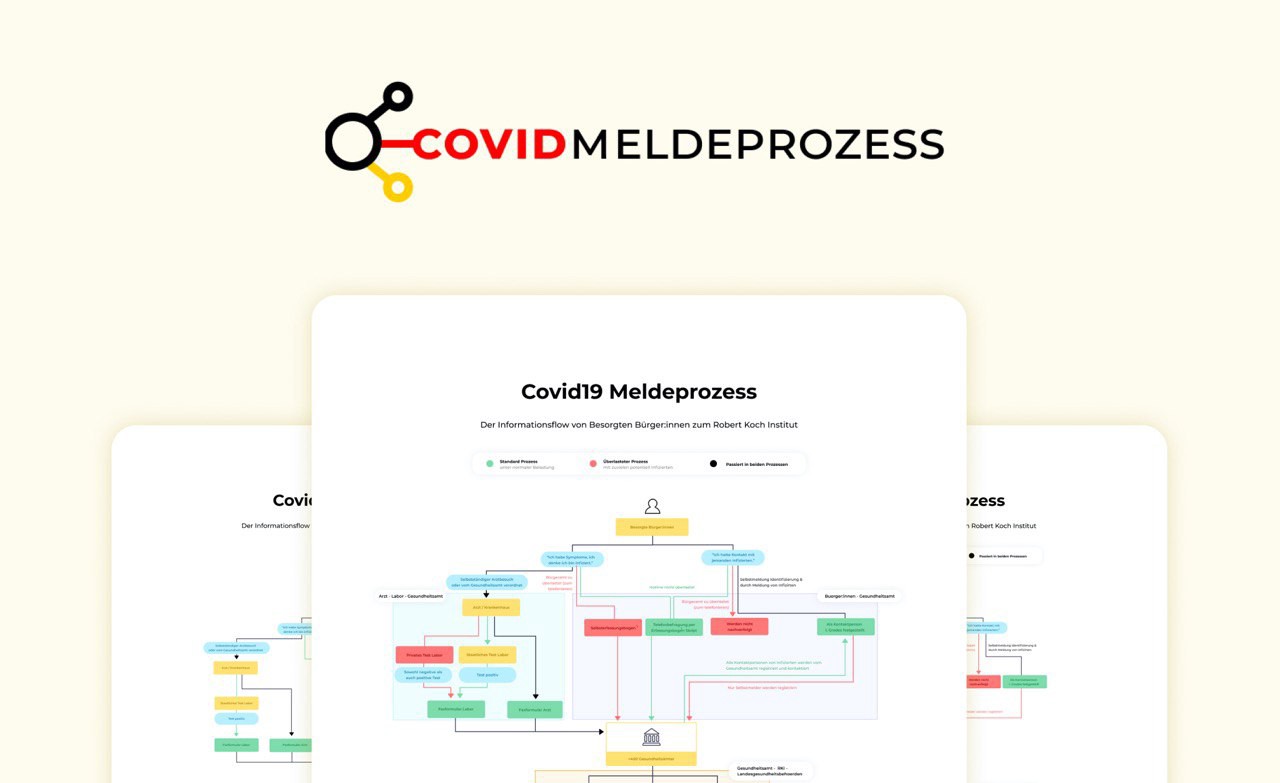
Together with Kerstin and Laura, who joined us on slack, we conducted more interviews and compiled our findings on a website designed by Viviane:
Since that content is in German I will briefly summarize some key findings:
People that enter the funnel either through infection or because they were in contact with an infected person are being monitored by about 400 local health institutions. This includes regular check-ins via telephone and analog forms with a few exceptions.
They each have different reporting forms and ways of aggregating their data. All of them eventually publish them to the Robert Koch Institute (RKI), which has been aggregating and analyzing the data for Germany.
This means that it can take 2–5 days for a reported case to reach the RKI and along the way, a lot of time is being spent on telephone check-ins with potentially infected people and cumbersome analog forms and processes.
The reporting software provided by the RKI has a closed interface and no public API forcing officials to keep a separate source of truth usually in an excel sheet.
Tl;dr The process is fragmented, manual and thereby costing workers in the administration valuable time while they are being flooded with requests by concerned citizens. On top of that data that is crucial for effective decision making is lagging severely.
Please do reach out to me, if this information is relevant to you or if you want to participate in the hackathon that is still ongoing and we are still working on refining our analysis.
Reflections on our work
The three of us worked very well together and had a nice complimentary stack of skills (design, product management, and engineering). Our other two teammates were also incredible: Kerstin was our contact and helped us get in touch with the right people, while Laura did a great job at compiling information writing copy.
I built the website from scratch on Netlify starting with nothing but an index HTML file. I like starting completely from scratch because frameworks easily trap you either in analysis paralysis if they require a lot of configuration or they lead you to bend the problem to your tool if they come with strong presets. Eventually, I upgraded to a boilerplate I had written some time ago so that I could benefit from templating and a better asset pipeline.
Viviane designed the website and infographic in Figma. This was a very nice choice since it allowed the rest of the team to collaborate in real-time in their browsers.
I think it’s fair to say that we could have dedicated more time to ask people for help with collecting data and conducting interviews. With the little time we had that could have allowed us to gather even more insights from people involved in other parts of the funnel. As for myself while
A final note
No one expected that we would launch into this decade with an unprecedented pandemic and it is already clear that some countries took too long to react and are still trying to avoid aggressive action. I cannot recall a time in my life where it has been more obvious that a historical inflection point of not one nation but all people were unfolding right before our eyes.
It’s not just about whether or not you get infected, it’s about how well we as a species are able to cooperate, empathize and ultimately defeat the enemy within, be it a virus or the distrust and fear that it sows.